Susan Blackmore and Tom Troscianko
British Journal of Psychology (1985), 76, 459-468 Printed in Great Britain
© 1985 The British Psychological Society
Abstract
Possible reasons for belief in the paranormal are discussed and two hypotheses suggested. The first – that some belief in psi arises from misjudgements of probability – predicts more errors in probability tasks among believers (sheep) than disbelievers (goats). In two experiments subjects completed various computer-controlled probability tasks. In the first sheep performed worse than goats on most tasks and were significantly worse at responding appropriately to changes in sample size. In Expt 2 sheep were significantly worse at questions involving sampling.
The second hypothesis is that some belief in psi arises from an illusion of control. Previous studies have shown a greater illusion of control among sheep in psi tasks (even when no psi occurs). We predicted the same effect in tasks not overtly involving psi. This was confirmed in Expt 3, using a computer-controlled coin-tossing task. Half the trials allowed for subject control of the coin and half did not. Sheep felt that they were exercising greater control than goats (irrespective of actual control) but estimated they had scored fewer hits. This could be explained if sheep misjudged chance scoring level. This was tested and sheep were found to underestimate chance scores. This ‘chance baseline shift’ could underlie the illusion of control and the belief in psi. No evidence of psi was found.
Why do people believe in the paranormal? Surveys show that such belief is widespread and even increasing (Truzzi, 1971). For example, Jones et al. (1977) found that 58 per cent of a sample of students believed in half or more of a list of paranormal phenomena and 27 per cent claimed to have experienced a paranormal phenomenon. Indeed the most common reason given for belief in the paranormal is one’s own experience. In a random postal survey Blackmore (1984) found that 25 per cent of respondents claimed to have experienced telepathy, 36 per cent professed belief in ESP (extrasensory perception) and of these 44 per cent cited their own experience as the main reason. It appears that the majority of believers are convinced that they have actually experienced the paranormal. A further question therefore raised is why people believe they have had paranormal experiences.
There are two main possibilities. One is that they have. The alternative is that their belief is based on misinterpretation of normal events as paranormal. Whether or not paranormal phenomena occur it is useful to understand the processes which might give rise to belief in psi even in its absence. The research reported here explores some of these.
The most commonly reported ‘psychic’ experiences include various forms of ESP (extrasensory perception) such as telepathy and precognitive or prophetic dreams (Zusne & Jones, 1982). These have in common that they depend on judgements of probability. For example, I might dream that I am standing outside my house and a green and red spotted car crashes into the fence. If the very next day I actually see this happen, I may judge that this is so improbable that some explanation other than ‘just chance’ is required. I may conclude that the dream was paranormal. This involves the judgement that an essentially unmeasurable probability is extremely low – too low to be ‘just coincidence’.
Probability judgements are notoriously inaccurate. Kahneman & Tversky (1973) have shown that a variety of heuristics, such as ‘representativeness’ are used to judge probabilities and may give rise to serious errors. People also show great confidence in their erroneous judgements, even in the face of contrary evidence (Einhorn & Hogarth, 1978). Errors in judgement of probability could give rise to belief in psi if, for example, people underestimated the probability of a ‘coincidence’. If this is a factor in such belief we should expect believers in the paranormal to make greater underestimations than non-believers. More generally we could hypothesize that the judgements of believers should be worse than those of disbelievers. Schmeidler (Schmeidler & McConnell, 1958) coined the terms sheep and goats respectively for believers and disbelievers in psi and we shall use these terms throughout. Expts 1 and 2 compared probability judgements for sheep and goats in a wide variety of tasks.
Another possible mechanism is selective forgetting, or errors in recall of probabilities. In the example given above I might forget all the dreams which did not come true and only remember those which did. Or I might misremember my original predictions. Fischhoff & Beyth (1975) asked subjects to estimate the likelihood of certain events and then, unexpectedly, to recall their own predictions and the actual outcomes. In retrospect subjects seldom perceived having been surprised by the actual outcome. If this kind of process contributes to belief in psi then we should expect sheep to be worse at recalling their own predictions accurately. More generally we might expect them to misremember events in a way which confirmed their belief in psi. Experiment 3 incorporated measures of recall to test this.
Another powerful mechanism involves the ‘illusion of control’ (Langer, 1975). This is especially relevant to PK (psychokinesis – the ability to influence objects or events without the use of muscular action). Under certain conditions people may feel that they are in control of essentially chance events. If no normal mechanism is obvious the illusory control may be attributed to psi. If this is the reason for some belief in psi then sheep should show a greater illusion of control than goats.
There is some previous research which bears on this. Langer (1975) found that the illusion of control was greatest when subjects thought that the task demanded some degree of skill. Langer & Roth (1975) pinpointed the conditions which enhance this effect (such as early success) and showed that there was a tendency for subjects to remember a higher number of successes than there had in fact been. In an ESP task Ayeroff & Abelson (1976) found that perceived success was enhanced by subjects’ involvement in the choice of test material and by being given a warm-up session: factors which would be expected to increase an illusion of control. Of course it is reasonable for a believer to expect such factors to enhance ESP success. However, in that study only subjective confidence in success was enhanced; actual ESP scores were at chance levels. Ayeroff & Abelson concluded that people behave in a chance situation as though it were a skill situation, to the extent that skill-related cues are present. However, it is important to note that for the believer in psi, an ESP task is a skill situation. Therefore, it is perfectly natural for him to display a greater illusion of control (and if psi exists possibly actual control).
This relationship between belief in psi and illusion of control was tested more directly by Jones et al. (1977) who found that subjects who scored higher on a paranormal belief scale gave higher estimates of their performance on a PK-type task than subjects who scored lower on the belief scale. Also Benassi et al. (1979) asked subjects to estimate their success during experiments on PK. Even though scoring was at chance levels, believers (either determined by instructional set or by rated belief) thought that they were exerting greater control than disbelievers.
These results allow the conclusion that in a PK task sheep showed a greater illusion of control than goats, even though no control (or PK) was exerted. However, they do not demonstrate that sheep show, in general, a greater disposition to an illusion of control. In tasks which are overtly based on ESP or PK it is natural that sheep will have higher expectations for their performance; they have a proposed mechanism for success and presumably believe that the task is essentially a skilled one (using the skill of psi). Goats perceive the task as a chance task. As we have already seen (Langer, 1975), a greater illusion of control appears when subjects think the task demands skill.
More important to our hypothesis here is whether the same relationship between belief and illusion of control will appear when the task is not overtly one involving psi (and no psi occurs). That is, the sheep and goats start with the same approach to the task. This is tested in Expt 3.
Finally, there is a long tradition in parapsychology of a relationship between belief in psi and performance on psi tasks – with sheep performing better than goats. Pioneering workby Schmeidler (Schmeidler & McConnell 1958), was followed by many replications and extensions of the original findings (see Palmer, 1971, for a review). More recently Layton & Turnbull (1975) manipulated both belief in psi and evaluation and found that those exposed to a positive evaluation scored higher on the ESP task. However, a replication did not repeat this finding.
In Expt 3 reported here we were able to test for a difference in ESP performance between sheep and goats. We predicted that sheep would perceive their performance as higher than goats, but that actual performance would not be.
Experiment 1. Probability tests
Method
Subjects. Subjects were 50 schoolgirls aged between 14 and 18 years, from Colston Girls’ School, Bristol.
Procedure. A room was set aside in the school and the subjects came one at a time to participate in the tests. One or other of the authors introduced the subject to the experiment and offered any help if needed. However, all the tests were run on an Apple II computer and were basically self-explanatory. Each session took between 10 and 15 minutes.
There were four separate types of task. First, subjects were told ‘A hat contains a large number of pieces of paper with the digits 1, 2, 3, 4 and 5 on them in equal proportion. Please write a list of 20 numbers in the order that you think they might be drawn from this hat’. In other words they were asked to generate a string of 20 random numbers. The number of doubles (i.e. the same digit produced twice consecutively) produced was counted where approximately four pairs are expected by chance. People are generally poor at generating random strings and generate fewer doubles than expected. We predicted that sheep would perform worse than goats, that is they would produce fewer doubles.
Second, subjects were presented with 12 examples of random mixtures of boys and girls invited to a party. In each case they were asked to assess whether the choice of boys and girls was biased or unbiased, using the semantic differential from 1 – certainly unbiased, to 5 – certainly biased. Mean score was recorded. Sheep were expected to give higher ratings.
Third, subjects were presented with eight examples of coin tossing and asked, as above, whether the coin was biased or not. For example, ‘I toss a coin 20 times and get “heads” 15 times. Is my coin biased?’. Proportions of ‘heads’ were either 50 per cent or 75 per cent and the number of tosses was either 4, 12, 20 or 60. It was predicted that goats would be more sensitive to the effect of varying sample size.
Fourth, subjects were asked four questions about sampling, including sampling with and without replacement. The questions and possible answers are listed in Appendix I. It was predicted that goats would more often give the correct answers.
Finally there were additional questions concerning experience of precognitive dreams, communication using telepathy, belief in ESP (Do you think that extrasensory perception is possible?), and belief in their own ‘psychic ability’. In each case a semantic differential was used from 1 – extremely unlikely to 5 – certain. Age was also asked. Subjects were thanked for their help and shown a printout of their scores if they wished.
Results
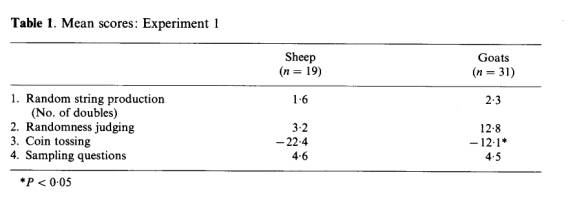
Subjects’ scores for the final four questions were added together to give a total ‘belief score’. Subjects were then divided about the mean to give 19 sheep and 31 goats. The results for each test are shown in Table 1.
The first prediction about random number production was not confirmed. As expected subjects produced fewer doubles than chance expectation (MCE = 4) and goats produced more doubles (mean 2.3) than did sheep (1.6), but the difference was not significant.
In the second task subjects were given a score reflecting how well they distinguished the random strings from the patterned ones. Again, as predicted, goats achieved higher scores (mean 12.8) than sheep (mean 3.2) but the difference was not significant.
In the coin-tossing tests there were two types of example; for those with equal numbers of heads and tails points were given if the rating decreased with increasing number of tosses; for those with 75 per cent heads points were given for increasing rating with sample size. The total score was a percentage of the theoretical maximum (see Appendix II). The subjects seemed quite unable to do this task correctly and their responses to changing sample size were often in the wrong direction, producing scores below zero. The mean score for all subjects was less than zero. As predicted, the sheep (mean -22.4) scored lower than the goats (mean –12.1). The difference is significant (t = 2-0, P < 0.05). Only four out of the 19 sheep obtained scores above 0.
Finally scores for the four sampling questions were added and compared for sheep (mean 4.6) and goats (mean 4.5) but no significant differences were found.
In summary, sheep were worse at responding appropriately to increasing sample size. The other differences were not significant but most were in the expected direction. That is, goats seemed to be better than sheep at tasks involving judgements about probabilities. It therefore seemed worthwhile to carry out similar tests with a larger number of subjects.
Experiment 2
Method
Subjects. Subjects were 100 volunteer students recruited through a poster in the Medical School of Bristol University. The poster asked them to take part in a 10-minute computer game. No further information was given.
Procedure. The tasks were similar to those in Expt 1 with the following differences. instead of using boys and girls at a party the students were given series of 12 digits (0-5 inclusive) and asked whether the numbers were randomly selected.
In the final section the questions about psi were embedded among others asking for an estimate of the likelihood (using the same five-point scale) of certain unpredictable events such as an earthquake in Bristol or rain next week. This was to avoid the possibility that subjects perceived a connection between the belief questions and the probability tasks and altered their answers accordingly.
Results
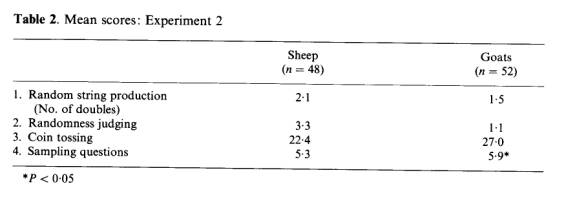
On the basis of their answers to the questions about psi the subjects were given total belief scores and divided about the mean to give 48 sheep and 52 goats. The results are shown in Table 2.
There were no significant differences between the two groups in the number of doubles generated in the random string, the score in the randomness – judging task or in the coin-tossing task. Overall for the sampling questions goats scored significantly higher than sheep, as expected (; = 2-58, d.f. = 98, P < 0-05, two-tailed). When the individual questions are taken separately the goats always scored better than or equal to the sheep. The difference on the ‘birthday’ question was independently significant. As predicted, moregoats than sheep got this right (chi square = 5.0, d.f. = 1, P < 0.05).
It is interesting to note that the students did not generally do any better than the schoolgirls, in spite of the fact that they were all older and were mostly university students. It appears that several more years of education and selection for university do not seem to improve ability at these types of probability tasks.
Experiment 3
Subjects took part in a computer game in which they tried to make a coin ‘fall’ as either ‘heads’ or ‘tails’, with control exerted via a push-button. Half of the trials made actual control possible and half did not. The latter could be used to look for PK effects. Dependent measures were the subject’s perceived degree of control, the remembered number of ‘hits’, an estimate of the subject’s belief in psi, and his or her age and sex. A further question was added during the experiment (see below).
The main prediction was that sheep would feel they had exerted greater control than goats, whether or not they had done so. Other predictions were that goats would be better able to distinguish between control and chance conditions, and that sheep would remember a higher ‘hit’ score than goats. All predictions were made in advance (Troscianko & Blackmore, 1983) and one-tailed tests were used when the direction was predicted.
After observing the behaviour of the first 47 subjects we also predicted that sheep are more likely than goats to misjudge the number of hits to be expected by chance. A further question to test this was added for subsequent subjects.
Method
Subjects. One hundred volunteer subjects were recruited by advertising in Bristol University’s Medical School. Most were students and staff. As an incentive a bottle of whisky (or similar) was offered to the highest scorer. There were 67 males and 33 female subjects.
Procedure. The task was a computer-simulated coin-tossing task. Each session consisted of two short practice runs followed by four experimental runs, each consisting of 20 trials. In each trial, subjects were first given a target to aim for: ‘heads’ or ‘tails’. They then started the coin-tossing sequence by pressing a push-button and the alternating faces were shown on the screen. The subjects’ task was to let go of the button at the correct time so that the target face would be the last shown.
There were (unknown to the subjects) two types of trial. Two runs consisted entirely of ‘control’ trials in which real control was possible. The other two were ‘chance’ trials in which no control was possible, as explained below.
The timing of stimuli was chosen, after pilot trials, to make the task difficult but not impossible. Heads and tails were shown for 200 ms each, with an inter-stimulus interval of 40 ms. When the button was pressed the alternating sequence started. When it was let go it stopped but with a delay of n further faces, dependent on the type of trial. In ‘control’ trials n was either 2 or 4 so that the sequence always ended on the same face as the one showing when the subject let go of the button. In ‘chance’ trials n could be 1, 2, 3 or 4 (with equal probability). This prevented any control being exerted by means of the push-button.
It has been suggested that PK can only be exerted on truly random (i.e. indeterminate) events (e.g. Millar, 1978) and it can be argued that pseudo-random sequences might be predictable by ‘normal’ means. The value ofn (which would be affected by any putative PK) was therefore determined from the state of an internal true random number generator based on thermal noise. All other randomization (such as order of runs, targets and first face shown) used the computer’s pseudo-random number generating function RND.
At the end of each run (of 20 trials) subjects were asked to indicate how much control they thought they had exerted over the outcomes of the coin tosses in that run. A seven-point scale was used (from no control to total control). At the end of the session (four runs) subjects were asked to estimate (i.e. recall) how many hits they had scored in each run. This question was not asked after each run because once subjects knew they were to be asked they would simply count the hits on subsequent runs. Next the following questions were asked, again with a seven-point scale:
1. Do you believe in the existence of ESP (extrasensory perception)?
2. Do you believe in the existence of PK (psychokinesis, i.e. the action of mind over matter)?
3. Do you believe that ESP/PK can be demonstrated in the laboratory?
Subjects were then asked their age and sex. The last 53 subjects (i.e. 48-100 inclusive) were also asked the following question:
4. Please estimate how many (out of 20)’ hits’ you would score if you did the test with your eyes shut.
All subjects were given a printout of their scores and asked not to communicate details of the experiment to others until the end of the series. All data were stored on disk for later analysis.
Results
The mean sum of ratings for the three questions about belief in psi was 12-67. This allowed division of the sample into 50 sheep and 50 goats.
There were 67 male and 33 female subjects. Of the females 16 were sheep and 17 goats; of the males 34 were sheep and 33 goats. Since there was no significant sex difference in beliefs all the data are presented collapsed across sex.
The average age of sheep was 25.1 years and of goats 27.7. Average female age was 28.6 and male 25.3. None of these differences is significant.
Our main prediction was that sheep would feel that they had exerted more control than goats, in both the control and the chance conditions. Table 3 shows the results obtained. These results confirm the main hypothesis, that sheep give a higher estimate of control than goats, in both types of run.
The information in Table 3 allows the following other conclusions to be drawn:
(1) There is no evidence of PK in the chance runs; the results are not significantly different from mean chance expectation. (2) There is no evidence that sheep scored differently from goats in the chance (or ‘PK’) runs; in fact the goats obtained a slightly higher score. We have therefore failed to replicate the ‘sheep/goat effect’. (3) In the control runs, both groups of subjects scored more hits than in the chance runs (t = 8.11, P < 10-9) and estimated that they were exerting more control (t = 5.37, P< 10-6). The chance and control conditions were therefore clearly discriminable.
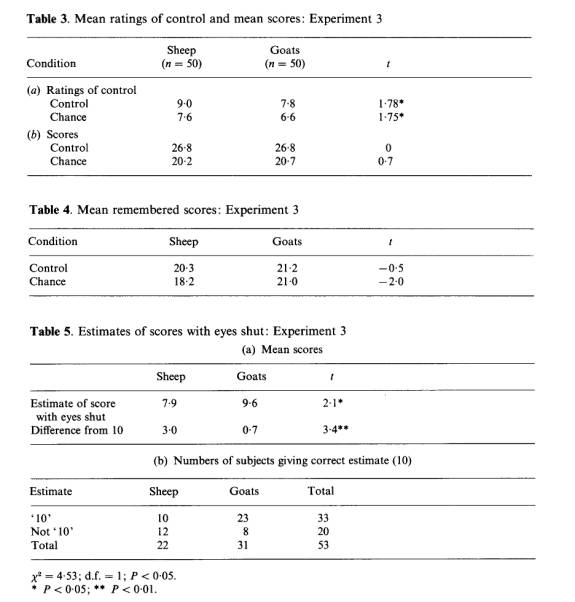
Our subsidiary predictions were (a) that goats would be better able to distinguish between chance and control trials, and (b) that sheep would remember a higher number of ‘hits’.
The first of these predictions was tested by taking the ratio of ratings in the control conditions to the ratings in the chance condition. The higher the ratio, the better the differentiation. The prediction was not confirmed. Sheep obtained a score of 1.24 and goats 1.25. The second subsidiary prediction was not confirmed either. The results are shown in Table 4.
In the chance condition the results are in the opposite direction to the one predicted and the difference cannot therefore be significant on the planned one-tailed test. In the control condition there is no significant difference either.
Our final hypothesis was that sheep are more likely to misjudge the number of hits to be expected by chance (i.e. by performing a visual task without visual information). This was tested, and confirmed, for the final 53 subjects. As predicted the goats gave more accurate estimates than the sheep. Where 10 is the expected answer goats gave a mean estimate of 9.6 and sheep 7.9 (; = 2.1, d.f. = 98, P = 0.02). Overall most subjects (33 out of 53) gave the answer ’10’, but most of these were goats. Of 31 goats 23 said ‘ 10’ but of 22 sheep only 10 did (chi squared = 4.53, d.f. = 1, P = 0.03). It seems clear that sheep more strongly underestimate the number of hits expected by chance. These results are shown in Table 5.
Discussion
Our main hypothesis was confirmed: sheep felt that they were exercising greater control over the outcomes of the tests than did goats, even though there was no difference in performance between the two groups. This suggests that sheep are more prone to an illusion of control in both psi and other tasks. Another interpretation of this is to say that goats are more cautious in their assessment of the control exercised.
Now consider the estimates of the number of ‘hits’, as made at the end of each session. Our prediction, that sheep would remember more hits than goats, was based on previous findings (Langer & Roth, 1975) that an illusion of control is associated with a higher remembered success rate. We found no such effect: quite the reverse. This appears counter-intuitive and therefore interesting. It prompted us to ask why sheep – who consider themselves to be exerting greater control than goats – say that they have scored fewer hits? We shall propose an answer which has other interesting implications.
In estimating how many hits they had scored in each of the four runs the subjects had to try to remember how well they had done throughout the experiment. At no stage were they told how many hits they had obtained in any run. They could of course count them as they went along, but they did not expect to be asked this question. The task was therefore difficult. When faced with such a difficult task it is reasonable to suppose that subjects might try to estimate how many hits they would be expected to get by chance, and then add an increment depending on how much they thought they might have ‘improved on chance’. The estimated value would therefore depend crucially on the estimate of chance scoring level. If this estimate were systematically wrong for sheep it might explain our paradoxical finding. It was this which prompted us to add the final question – asking subjects how well they thought they would do if they tried the experiment with their eyes shut.
As we have seen sheep severely underestimated the chance level of 10 while goats werefairly accurate. Therefore the sheep might feel that a score of 9 out of 10 represented a score better than chance; whereas a goat would (correctly) classify it as below chance.
This not only explains the discrepant finding but also provides a possible mechanism by which both the illusion of control and belief in psi could be continuously reinforced. If a person consistently underestimates the size of any pure chance effect, then when chance outcomes occur he will seek an additional explanation. This may be in terms of his own control and so produce an illusion of control, or may be interpreted as psi, so confirming his belief in the paranormal. In this way errors in judgements of probability might underlie both the illusion of control and belief in psi. We have termed this effect the ‘chance baseline shift’.
We should emphasize that this explanation is tentative and in need of further investigation. It could, for example, be argued that our question could have been misunderstood by the subjects. It would also be helpful to repeat the experiment with non-university subjects. However, our finding is potentially interesting in that it suggests a possible mechanism by which belief in psi could receive constant reinforcement in theabsence of any actual psi. In future experiments we will investigate the putative chance baseline shift more fully to establish under what conditions it is likely to occur.
Conclusions
The three experiments reported here have demonstrated some interesting differences in behaviour between those who do and do not believe in psi. In the first two experiments most of the differences, and all the significant ones, were in the direction of the goats performing better than sheep at tasks requiring judgements of probability. This is in line with our hypothesis that some belief in psi arises from misjudgements of probability.
In the final experiment we found that sheep showed a greater illusion of control than goats even though the task was not overtly a psi task and no psi occurred. This confirms our prediction from the hypothesis that belief in psi may be fostered by an illusion of control.
When asked to estimate how well they would perform at this visual task if no visual information were available the goats gave more accurate estimates than the sheep – the sheep seriously underestimating chance expectation. We suggest that this ‘chance baseline shift’ may strengthen belief in psi even when no psi occurs.
Acknowledgements
We would like to thank Francois Dupre for his assistance with programming and runningExpt 3. He was on a visit funded by Ecole Superieure d’lngenieurs en Electrotechnique etElectronique, 89 Rue Falguiere, 75015 Paris, France.
S. Blackmore was funded by the Perrott-Warrick Studentship in Psychical Research.
T. Troscianko was funded by a grant from the Nuffield Foundation.
We would also like to thank the Headmistress and pupils of Colston Girls’ School, Bristol.
References
Ayeroff, F. & Abelson, R. P. (1976). ESP and ESB: Belief in personal success at mental telepathy. Journal of Personality and Social Psychology, 34, 240-247.
Benassi, V. A., Sweeney, P. D. & Drevno, G. E. (1979). Mind over matter: Perceived success at psychokinesis. Journal of Personality and Social Psychology, 37, 1377-1386.
Blackmore, S. J. (1984). A postal survey of OBEs and other experiences. Journal of the Society for Psychical Research, 52, 225-244.
Einhorn, H. J. & Hogarth, R. M. (1978). Confidence in judgment: Persistence of the illusion of validity. Psychological Review, 85, 395-4l6.
Fischhoff, B. & Beyth, R. (1975). ‘I knew it would happen’: Remembered probabilities of once-future things. Organizational Behaviour and Human Performance, 13, 1-16.
Jones, W. H., Russell, D. W. & Nickel, T. W. (1977). Beliefs in the paranormal scale: An objective instrument to measure beliefs in magical phenomena and causes. JSAS Catalog of Selected Documents in Psychology 7, 100 (Ms No. 1577).
Kahneman, D. & Tversky, A. (1973). On the psychology of prediction. Psychological Review, 80, 237-251.
Langer, E. J. (1975). The illusion of control. Journal of Personality and Social Psychology, 32, 311-328.
Langer, E. J. & Roth, J. (1975). Heads I win, tails it’s chance: The illusion of control as a function of the sequence of outcomes in a purely chance task. Journal of Personality and Social Psychology, 32, 951-955.
Layton, B. D. & Turnbull, B. (1975). Belief, evaluation and performance on an ESP task. Journal of Experimental Social Psychology, 11, 180-191.
Millar, B. (1978). The observational theories: A primer. European Journal of Parapsychology, 2, 304-332.
Palmer, J. (1971). Scoring in ESP tests as a function of belief in ESP. Part 1. The sheep-goat effect. Journal of the American Society/or Psychical Research, 66, 1-26.
Schmeidler, G. R. & McConnell, R. A. (1958). ESP and Personality Patterns. Westport, CT: Greenwood Press.
Troscianko, T. & Blackmore, S. J. (1983). Sheep-goat effect and illusion of control. In W. G. Roll, J. Beloff & R. A. White (eds), Research in Parapsychology 1982. Metuchen, NJ: Scarecrow Press.
Truzzi, M. (1971). Definition and dimensions of the occult: Towards a sociological perspective Journal of Popular Culture, 5, 635-646.
Zusne, L. & Jones, W. H. (1982). Anomalistic Psychology. Hillsdale, NJ: Erlbaum.
Received 21 January 1985
Requests for reprints should be sent to Susan Blackmore, Brain and Perception Laboratory, Department of Anatomy, The Medical School, University Walk, Bristol BS8 1TD, UK. Tom Troscianko is also at the above address.
Appendix I
Full text of questions, section 4, Expts 1 and 2
(a) ‘A hat contains 10 red and 10 blue smarties. I pull out 10 and 8 of them are red. Am I more likely to get red or blue next time?’ Possible answers given were ‘red’, ‘blue’ or ‘either equally likely’.
(b) ‘A box contains buttons that are either green or yellow, in unknown proportion. Out of 10 buttons taken out 8 were yellow. Which is more likely to be pulled out next?’ Possible answers were ‘green’, ‘yellow’ and ‘either equally likely’.
(c) ‘ A coin is tossed to decide which football team kicks off first. In the last four matches between Mytholmroyd Athletic and Giggleswick United, Mytholmroyd have kicked off first every time. Which is more likely to kick off first at their next encounter?’ Possible answers were ‘Mytholmroyd’, ‘Giggleswick’ and ‘either equally likely’.
(d) ‘ How many people would you need to have at a party to have 50:50 chance that two of them will have the same birthday (not counting year)? Possible answers were 22, 43 and 98.
It was predicted that goats would be more likely to answer (a) blue, (b) yellow, (c) either and (d) 22.
Appendix II
Method of scoring ‘coin-tossing’ question
Assume that the sample size presented is n. Then, for the case in which the proportion of ‘heads’ is 75 per cent, a correct response would increase the bias rating with increasing n.Thus, we incremented the score by 1 if the subject actually responded in this way, by zero if the subject gave the same rating, and by – 1 if the subject decreased the bias rating as nincreased. Thus, the score represents by how much a subject changes his or her rating, irrespective of its absolute value. Similarly, for the cases when the proportion of ‘heads’ was 50 per cent the score was incremented by 1 if the subject’s rating decreased as nincreased, by zero if it remained constant, and by — 1 if it increased.
The overall effect of this scoring method was to ensure that a high positive score would only be obtained if the subject responded both to increasing n and to the proportion of ‘heads’. The score was normalized so that the possible range was -100 to + 100.
This article has been scanned. Please let me know if you find any mistakes.